




HRV Metrics Explained
Your wearable shows you an HRV number. But which number? There are over a dozen ways to quantify heart rate variability, each capturing something slightly different about your autonomic nervous system. Here is what the most important ones mean, in plain language.
Time-Domain Metrics
Time-domain metrics analyse the variation between heartbeats directly, without any frequency transformation. They are the most intuitive and the most commonly reported by consumer wearables.
RMSSD is the single most important HRV metric for most people. It measures the beat-to-beat variation by calculating the average of the squared differences between consecutive RR intervals, then taking the square root. It primarily reflects parasympathetic (vagal) nervous system activity, making it the closest thing to a direct readout of your vagal tone.
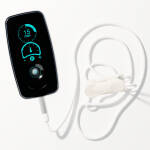
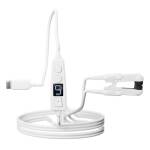
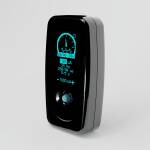
This is the metric that WHOOP, Oura, Apple Watch, and most consumer devices report when they show you an "HRV" number. It is also the metric we calculate in real-time during Vagal HRV monitoring sessions.
SDNN measures the overall variability of all normal-to-normal heartbeat intervals over a recording period. Unlike RMSSD, which captures only beat-to-beat changes, SDNN reflects the total variability, including both sympathetic and parasympathetic contributions. The Task Force of the European Society of Cardiology considers SDNN the gold standard for clinical HRV assessment when measured over 24 hours.
An important caveat: SDNN is heavily influenced by recording length. A 5-minute SDNN and a 24-hour SDNN are fundamentally different measurements and should never be compared directly. The clinical threshold of SDNN below 50ms (associated with increased cardiac risk) applies only to 24-hour recordings.
pNN50 counts how many pairs of consecutive heartbeats differ by more than 50 milliseconds, expressed as a percentage of the total. Like RMSSD, it reflects parasympathetic activity, but it is less sensitive to small variations. It tends to be most useful in populations with relatively high HRV, such as young, fit individuals. In older or less active populations, pNN50 can be very low or zero even when RMSSD still shows meaningful variation.
Frequency-Domain Metrics
Frequency-domain analysis decomposes the HRV signal into its component rhythms using spectral analysis (typically a Fast Fourier Transform). Different frequency bands correspond to different physiological mechanisms.
The high-frequency band corresponds to respiratory sinus arrhythmia, the natural quickening of your heart rate during inhalation and slowing during exhalation. This rhythm is mediated almost entirely by the vagus nerve, making HF power a well-established marker of parasympathetic activity. It is closely correlated with RMSSD, just measured in a different mathematical domain.
The low-frequency band is often mischaracterised as reflecting "sympathetic activity." The reality is more complex. LF power reflects a mixture of both sympathetic and parasympathetic influences, along with baroreflex activity. It should not be interpreted as a pure sympathetic marker.
The LF/HF ratio was once widely promoted as a measure of "sympathovagal balance." This interpretation has been substantially challenged in the literature. Because LF reflects both branches of the autonomic nervous system rather than sympathetic activity alone, the ratio does not cleanly represent what it claims to. Many researchers now recommend interpreting LF and HF separately rather than as a ratio, and some consider the ratio misleading. If you see it reported, treat it with caution.
Non-Linear Metrics
Non-linear methods capture aspects of HRV that time-domain and frequency-domain metrics miss, particularly the complexity and self-similarity of heart rhythm patterns.
A Poincare plot graphs each heartbeat interval against the one that follows it. The resulting scatter cloud reveals two dimensions of variability. SD1 (the width of the cloud perpendicular to the identity line) reflects short-term, beat-to-beat variability and correlates closely with RMSSD and vagal tone. SD2 (the length of the cloud along the identity line) reflects longer-term variability and is related to SDNN. The SD1/SD2 ratio provides a snapshot of the balance between short-term and long-term regulatory mechanisms.
We calculate SD1, SD2, and their ratio in real-time during Vagal HRV monitoring sessions, providing a richer picture than RMSSD alone.
Which Metric Should You Use?
For daily tracking
Use RMSSD. It is the most validated short-term metric, it reflects vagal tone directly, and it is what your wearable almost certainly reports. Take your reading first thing in the morning, in the same position, for 1-2 minutes. Track the trend over days and weeks, not individual readings.
For clinical assessment
SDNN from a 24-hour Holter recording remains the gold standard. It captures the full picture of autonomic function across the day-night cycle, including circadian variation that short readings miss entirely.
For understanding intervention effects
Compare RMSSD (and ideally SD1 from a Poincare analysis) before, during, and after an intervention. This is exactly what our HRV study does during vagus nerve stimulation sessions: measuring how tVNS shifts parasympathetic metrics in real time.
The most important thing is consistency. Pick a metric, measure it the same way each time, and watch the trend. A single HRV reading tells you almost nothing. A month of consistent morning readings tells you a great deal.